Panes
Multi-pane charts are created by passing pane_index to series constructors, or
by calling chart.add_pane() to explicitly create extra panes.
Note:
create_subcharthas been removed. Use the Panes API described here and in thePanereference.
MACD Sub-Pane
Add a histogram to a second pane using pane_index=1:
import pandas as pd
from lightweight_charts import Chart


def calculate_sma(df, period=50):
    return pd.DataFrame({
        'time': df['date'],
        f'SMA {period}': df['close'].rolling(window=period).mean()
    }).dropna()


def calculate_macd(df, short=12, long=26, signal=9):
    short_ema = df['close'].ewm(span=short, adjust=False).mean()
    long_ema  = df['close'].ewm(span=long,  adjust=False).mean()
    macd      = short_ema - long_ema
    sig       = macd.ewm(span=signal, adjust=False).mean()
    return pd.DataFrame({
        'time':      df['date'],
        'MACD':      macd,
        'Signal':    sig,
        'Histogram': macd - sig,
    }).dropna()


if __name__ == '__main__':
    chart = Chart(inner_height=1)
    chart.legend(visible=True)

    df = pd.read_csv('ohlcv.csv')
    chart.set(df)

    line = chart.create_line('SMA 50')
    line.set(calculate_sma(df, 50))

    # ── second pane ──────────────────────────────────────────────────────────
    macd_data = calculate_macd(df)
    histogram = chart.create_histogram('MACD', pane_index=1)
    histogram.set(macd_data[['time', 'MACD', 'Signal', 'Histogram']])
    chart.legend(visible=True, pane_index=1)

    chart.show(block=True)
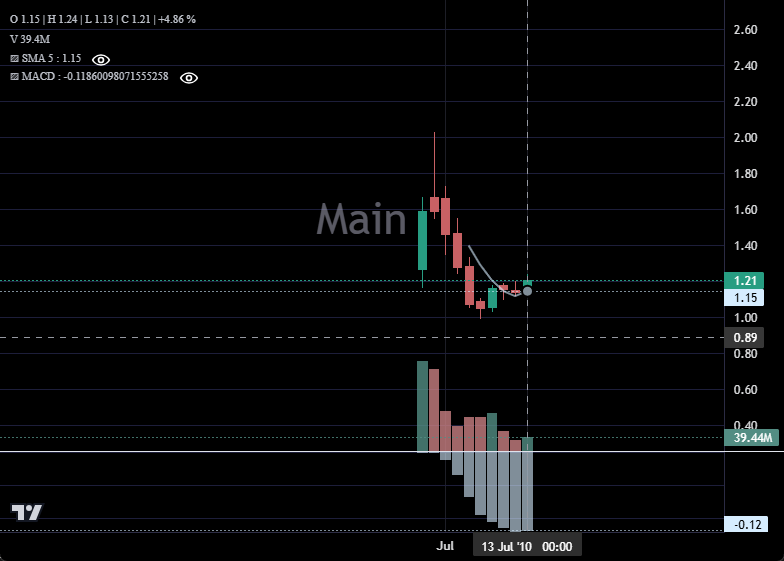
chart.watermark('1')
chart2.watermark('2')
chart3.watermark('3')
chart4.watermark('4')

df = pd.read_csv('ohlcv.csv')
chart.set(df)
chart2.set(df)
chart3.set(df)
chart4.set(df)

chart.show(block=True)
___

## Synced Line Chart

```python
import pandas as pd
from lightweight_charts import Chart

if __name__ == '__main__':
    chart = Chart(inner_width=1, inner_height=0.8)
    chart.time_scale(visible=False)

    chart2 = chart.create_subchart(width=1, height=0.2, sync=True)
    line = chart2.create_line()

    df = pd.read_csv('ohlcv.csv')
    df2 = pd.read_csv('rsi.csv')

    chart.set(df)
    line.set(df2)

    chart.show(block=True)